When my husband and I were considering elementary schools for our son in Washington, DC in the early 2000s, I focused on the private schools, the ones that cost around $20,000 per year (for kindergarten; often more for higher grades) and that did not provide transportation, before or after school programs, nor school lunch. My husband, ever progressive, a public servant with political aspirations, wanted our son to go to DC public schools. Not having grown up in the area, neither my husband nor I was a product of DC public schools, and the educational outcomes of DC public schools as widely reported at the time did not bode well for most students; I did not want my extraordinary bundle of boy to be among them. A charter school was our compromise, but our saving grace was actually two schools and three years later, when a new-to-the-District superintendent, perhaps eager to make his mark or at least rid himself of complaint and implied threats of litigation from my husband (the attorney), gave us a choice to enroll our son in any one of the three best public schools in the city. Typically, these plum schools are reserved for the residents of the schools’ surrounding neighborhoods, or those who benefitted from a lottery system characterized by ‘out of boundary’ parents camping outside the coveted schools’ doors overnight, in order to be among the first to receive a lottery ticket. Being given our choice of schools wasn’t fair, but it was fortuitous, and the rest of my son’s elementary school years passed like a charm.
At the time, the school board in DC was an elected one and was assumed rife with all the implications of politics. Teachers unions were strong and DCPS had many veteran, tenured teachers who, some believed, were R.I.P. (retired in place)– biding their time till retirement as glorified babysitters with low expectations. Parents with options chose charter or private schools or moved to the Maryland or Virginia suburbs where there were better educational outcomes.
The obstacles are frightening: the achievement gap of 70 percentage points between blacks and whites in the city’s high schools. The tragic truth that only 9 percent of D.C. high school students will graduate from a college within five years of leaving the city’s system. The depressing fact that only 8 percent of ninth-graders are proficient in math. “The poor black fourth-graders in New York City are two full grades ahead of the poor black fourth-graders in Washington, D.C.,” Rhee says.
In 2009, then-DC Public Schools (DCPS) Chancellor Michelle Rhee implemented IMPACT, a valued-added assessment system that tied teacher compensation and retention to performance. Student test results on the DC Comprehensive Assessment System (DC-CAS) test were just one component of a teacher’s IMPACT rating –along with observations and evaluation using a rubric that emphasized student mastery of content. Teachers spent weeks ‘teaching to the test’; perhaps motivated by Administration pressure and the nascent system of reward or punishment. The ratings were devised as follows:
For general ed. teachers with value-added data (students take DC CAS)
• 50% Individual valued added student achievement data
• 35% Teacher evaluations
• 10% Commitment to school community
• 5% School value added student achievement dataFor general ed. teachers without value added data (students do not take DC CAS)
• 75% Teacher evaluations
• 10% Teacher assessed student achievement data
• 10% Commitment to school community
• 5% School value added student achievement data
Rhee’s emphasis on teacher quality and her value-added approach to teacher compensation and retention was thought to be influenced by economic studies that predicted significant increases in educational performance simply by eliminating the worst 5 to 10 percent of teachers. The table below depicts DCPS teacher dismissals.

Unfortunately, due to the fallibility of IMPACT’s design, it’s likely that not just the worst teachers opted– or were told–to leave DCPS. As education historian Diane Ravitch noted:
And so I concluded that value-added assessment should not be used at all. Never. It has a wide margin of error. It is unstable. A teacher who is highly effective one year may get a different rating the next year depending on which students are assigned to his or her class. Ratings may differ if the tests differ. To the extent it is used, it will narrow the curriculum and promote teaching to tests. Teachers will be mislabeled and stigmatized.
When Michelle Rhee departed DCPS in 2010, her deputy, Kaya Henderson, who had been instrumental in the development of IMPACT, took over as Chancellor. The DC-CAS test was last administered in 2013-14 and was replaced by Partnership for Assessment of Readiness for College and Careers (PARCC), an assessment aligned to Common Core Standards developed by a group of states and administered in grades 3-8. PARCC standards are more rigorous, as Kaya Henderson explained to parents, and test results reflected that.
Now that there’s several years worth of data to evaluate, it is possible to determine whether the presumed increase in teacher quality due to the value-added IMPACT assessment yielded improved educational outcomes.
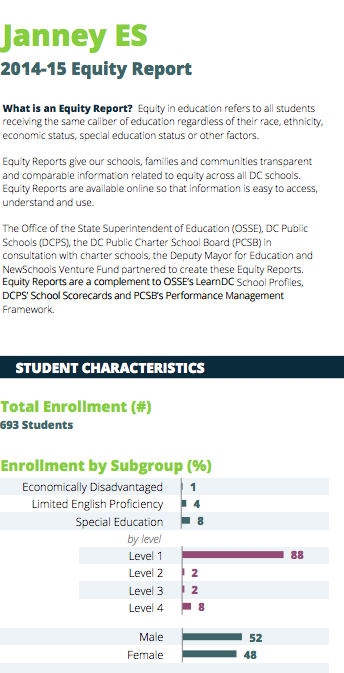
Below are DC-CAS and PARCC scores from 2011-12 through 2014-15 for the DCPS elementary school that my son attended, and the elementary school to which I’ve been assigned to complete my practicum. Although the latter is a charter school, it is governed under the auspices of DCPS and the students are subject to the same standardized testing.
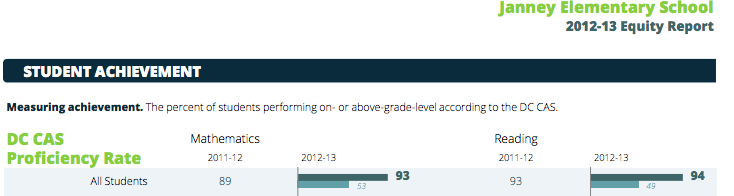
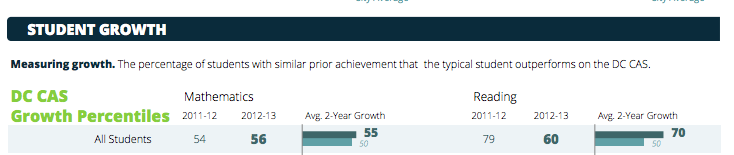
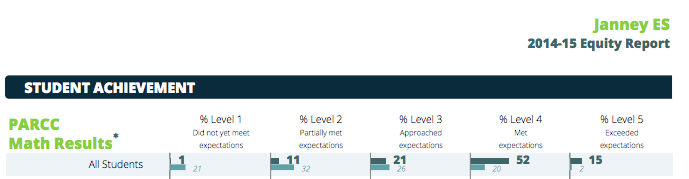
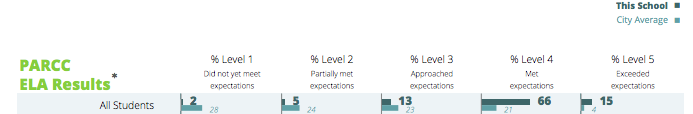
The DC-CAS data shows that 89-94% of Janney students were performing at or above grade level in Math and Reading from 2011-2013, and that more than 50% evidenced more growth than typical students taking the test in those years. The PARCC results for 2014-15 shows that more than 50% of students met expectations in Math and Reading, and 15% exceeded those expectations.
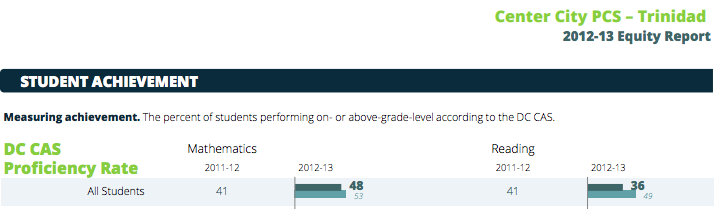
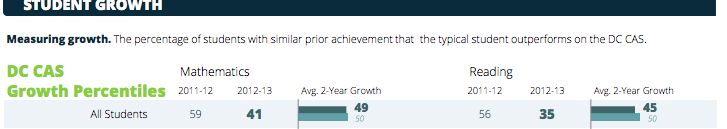
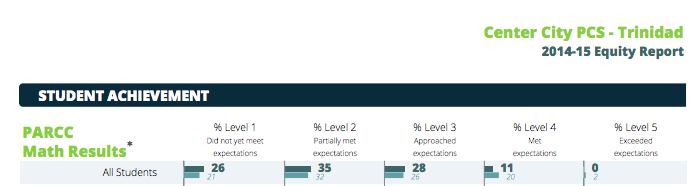
By contrast, only 41% of students at Center City PCS-Trinidad performed at or above grade level in Math and Reading in 2011-12. In 2012-13, 48% performed at or above grade level in Math, while those performing at or above grade level in Reading declined to 36%. The percentage of improvement decreased in both subject areas from 2011 to 2013.
Based on the data for these two schools, no correlation can be made between teacher quality and improved educational outcomes. Demographic enrollment data suggests a correlation between the student’s home environment and educational outcomes, however.
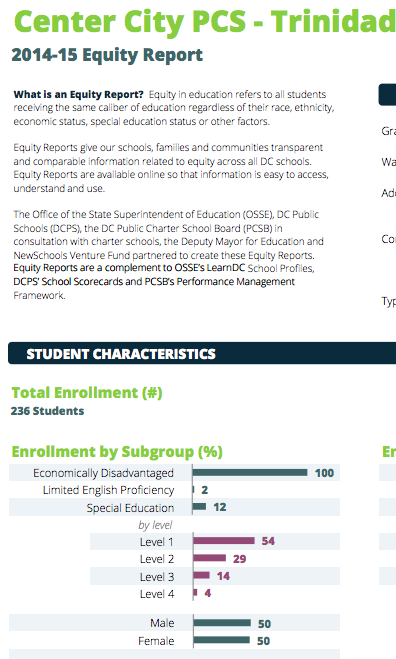
Center City PCS-Trinidad is characterized as a Title 1 school, given the predominance of economically disadvantaged students. It is one of the schools at which teachers rated Highly Effective as a result of the IMPACT assessment would receive a salary bonus.
Janney, by contrast, has 1% of its student population characterized as economically disadvantaged. Janney’s PTA raised over $1.4 million dollars to support school programs in a recent year. When my son was a student there, our fundraising had curricular implications; the PTA funded the salary of a teacher to teach Chicago Math.
Standardized test scores, teacher quality, school culture and classroom expectations may all contribute to educational outcomes, but it seems poverty, and perhaps more than that, the culture and environment often associated with it, has substantive impact, no more starkly evidenced than by the “thirty million word” literacy gap. Education reformers may have the best long term job security of all.
References